dtc e commerce
DTC E Commerce Explained: How the Model Actually Works
A practical guide to dtc e commerce covering the business model, economics, channels, and common operating challenges founders face when selling direct.
Updated October 21, 2026
You've got a product people like. Maybe you make it, maybe you import it, maybe you've sold it through a shop or a marketplace and you're tired of watching someone else control the price, the customer, and the margin. So you open a laptop, build a store, and think, I'll just sell it myself.
That's the moment most founders step into DTC e commerce without quite naming it. It sounds simple. Sell direct, keep the margin, own the relationship. The simplicity is real, and so is the work that comes with it. You're not just opening a storefront. You're taking on jobs that retailers, distributors, and marketplaces used to do for you, from finding customers to handling returns. Understanding that trade, in plain terms, before you spend on ads or inventory, saves you from learning it the expensive way.
Table of Contents
- What DTC E Commerce Actually Means
- How the DTC Model Came to Look the Way It Does
- The Economics Behind a DTC Brand
- The Channels and Operating Stack a DTC Brand Runs
- What the Model Looks Like in the Wild
- The Funnel Problems Most DTC Brands Underestimate
- Operating Challenges Every DTC Founder Eventually Meets
What DTC E Commerce Actually Means
An apt comparison is running your own small shop rather than renting a shelf in another business's supermarket. In the supermarket, the owner decides where your product sits, what it costs during a promotion, and what the shopper sees next to it. In your own shop, you make all those decisions, yet you also pay the rent, staff the checkout, and entice customers to walk through your door in the first place. That is direct-to-consumer ecommerce in a nutshell.
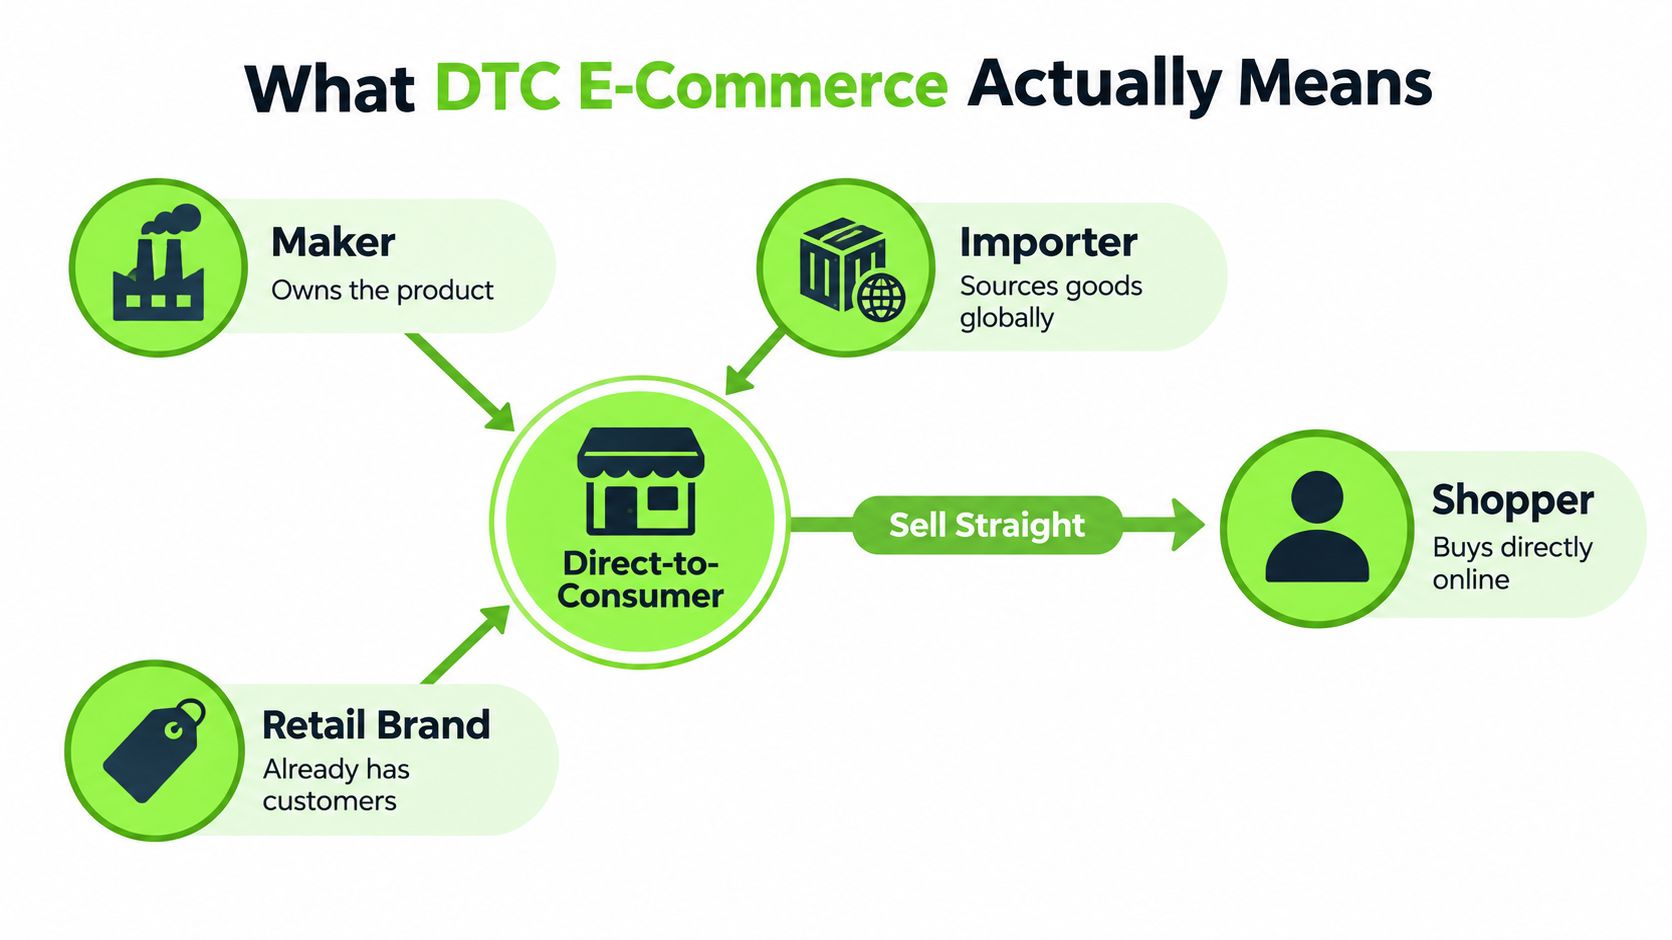
More precisely, a DTC brand owns the storefront, runs the transaction, holds the customer relationship, and keeps the data from that sale. There's no wholesaler buying in bulk and reselling for you, and no marketplace taking the order under its own name. When a shopper buys skincare from the brand's own site, pays the brand, gets emails from the brand, and returns the product to the brand, that's dtc e commerce at work.
How it differs from marketplaces and retail
On Amazon or another marketplace, the platform owns the customer. You get an order, but you often don't get a usable email address, control over the product page layout, or freedom to set the post-purchase experience. The marketplace brings traffic and trust, and in exchange it sets the rules and keeps the relationship.
Through a retailer, the split is different again. The retailer buys from you at a wholesale price, marks it up, and handles the shopper. You gain shelf space and volume, but you learn very little about who bought your product or why. If the retailer discounts a competitor next week, you feel it without controlling it.
The four things you actually control
- Pricing: You set the price, the bundle, and the discount, and you see immediately how shoppers respond.
- Branding: Your product page, packaging, and emails tell the story in your words, not a retailer's template.
- First-party data: You can see which ad brought a visitor, what they viewed, and whether they returned, because the visit happened on your site.
- Post-purchase relationship: You decide the tracking email, the reorder reminder, and how a complaint gets resolved.
Control is the product. Responsibility is the price.
That responsibility is worth naming early. You'll choose a payment provider, answer support tickets, manage stock, and pay to acquire customers who might have found you for free on a busy marketplace. Many founders still choose DTC because those owned relationships compound. A customer you can email, learn from, and sell to again is a different asset from an anonymous marketplace order, even if the first order costs more to win.
How the DTC Model Came to Look the Way It Does
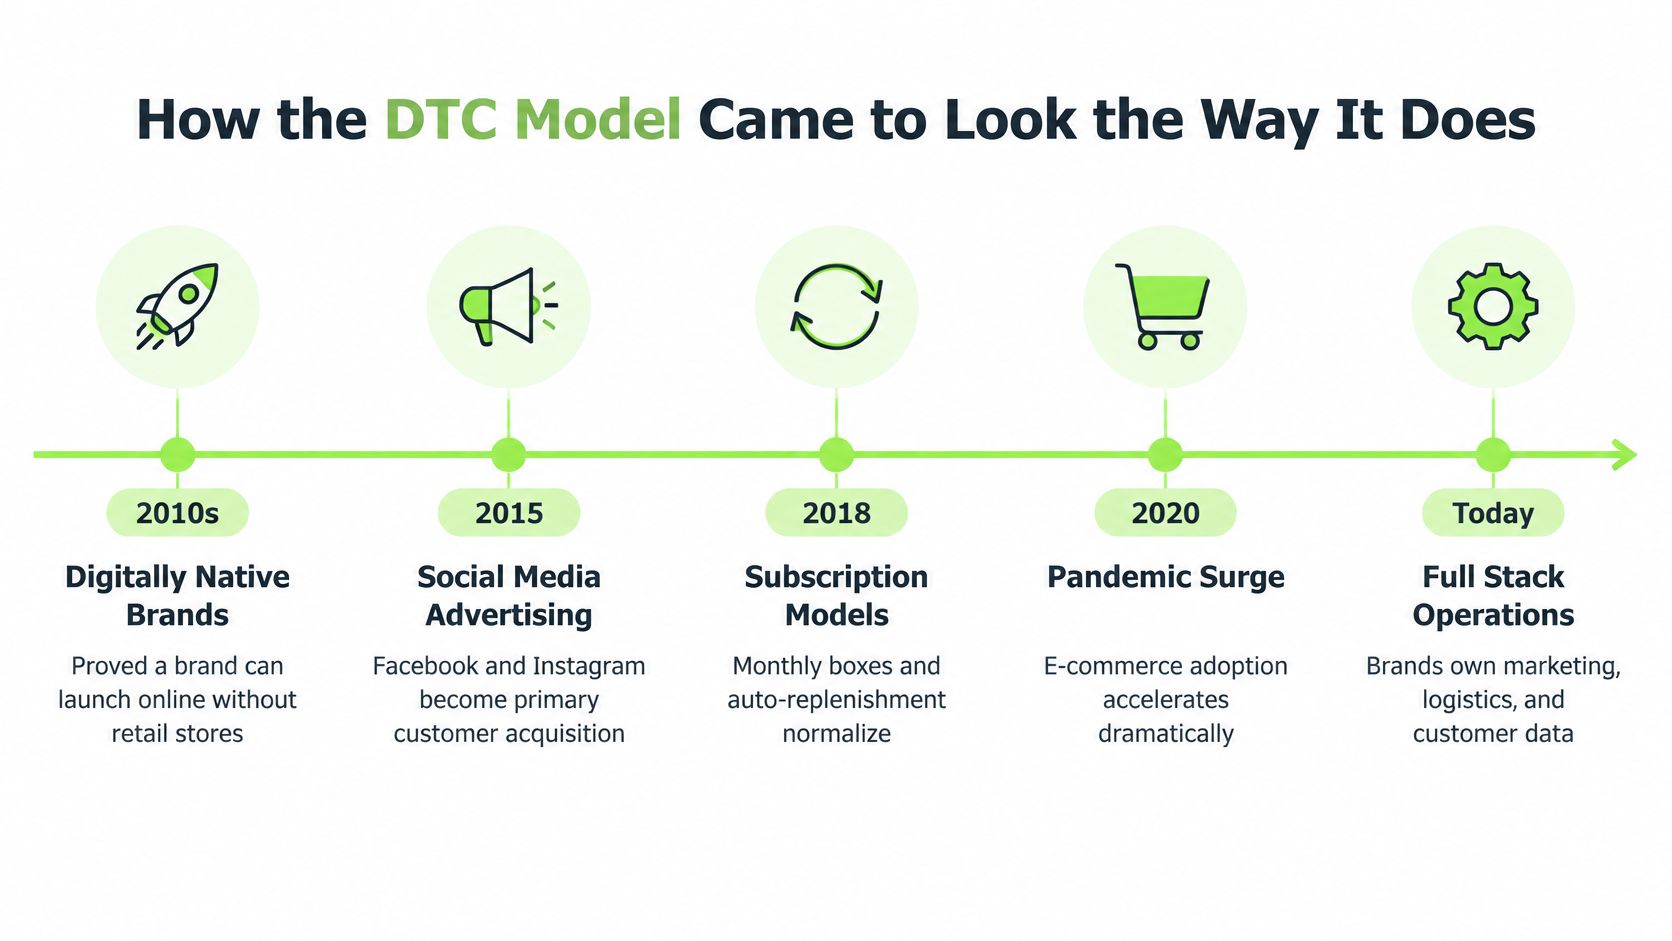
In the 2010s, a wave of digitally native brands showed that you didn't need national shelf space to build a national brand. The pattern repeated so often it became a template. Pick one hero product, build a clean Shopify store, run paid social ads to a tightly defined audience, and use early sales and reviews to refine the offer. A mattress, a razor, a suitcase, the category varied, but the operating logic stayed similar.
Those brands treated the store as both shop and laboratory. They could change a headline in the morning, test a new bundle by afternoon, and read the result in orders and support tickets. Traditional retail couldn't move that fast. That speed, more than any single product, explains why so many playbooks still start with Meta advertising, a focused product page, and a subscription or replenishment option where the product allows it.
The 2020 acceleration
Then 2020 pushed almost everything online at once. A KPMG review of direct-to-consumer growth reports that global retail ecommerce grew 26% in 2020 and another 16% in 2021, while DTC ecommerce channels recorded an estimated 45% growth in 2020. Restrictions moved acquisition, merchandising, checkout, fulfillment, and retention online at the same time, so brands that already had a store and an ad account could test and scale under unusually favorable conditions.
That moment also sat inside a much larger market. UNCTAD's global ecommerce estimates put global B2C ecommerce sales at US$4.9 trillion in 2019, with online retail in seven large economies rising from about US$2.0 trillion in 2019 to US$2.9 trillion in 2021. DTC is a narrower model inside that B2C total, not the total itself. Founders confuse the two when they treat busy ad libraries or rising store counts as proof of revenue.
What stayed after growth slowed
Growth moderated after that surge, but the structural change didn't reverse. DTC settled in as a permanent route to market alongside marketplaces and physical retail, rather than a pandemic substitute for them. Adoption also isn't uniform. The KPMG review notes DTC represented roughly one in five online purchases in China and one in six in North America, shaped by payments, logistics, marketplace strength, and consumer habits in each place.
That's the environment you're building into today. The tools look familiar because they were forged when attention was cheaper and shipping a test was easy. Your job isn't to copy a 2019 playbook. It's to understand why each piece exists, then decide whether it still earns its place for your product and margins.
The Economics Behind a DTC Brand
Revenue is the easiest number to celebrate and the least useful number for deciding whether to scale. A store can grow every week and still lose money on every first order. To see why, follow one sale from the top down, in the order the money leaves.
Start with gross revenue, what the customer pays for the product before costs. Subtract the cost of making or buying that product and you get gross margin. If a hypothetical product sells for 100 units of currency and costs 50 to make, you've got 50 left. That sounds healthy until the next layer arrives. Shipping, packaging, payment fees, fulfillment labor, returns, and support time all come out of that 50. What's left after those variable costs is contribution margin, the money an order contributes toward ads, salaries, and profit.
Then you pay to win the customer. Customer acquisition cost, or CAC, is your ad and marketing spend divided by the new customers it produced. If CAC eats the entire contribution margin on order one, you're relying on a second or third order to get paid back. The time that takes is your payback period, and it affects cash as much as profit. A brand can be profitable on paper over a year and still run out of cash this month because payback is slow.
Why a good ROAS can still lose money
Practical rule: Never judge an ad by revenue alone. Judge it by what's left after the order is fully served.
Benchmark data in Amp's 2025 DTC mega report shows a median contribution margin of 48%, yet 31% of brands fall below 10%, more than half are still unprofitable after the first order, and the median LTV to CAC ratio is 2.4x. Those figures explain why acceptable ROAS can't be a universal number. A high-margin replenishment product, like a consumable customers reorder, can tolerate aggressive acquisition because lifetime value has time to build. A low-margin, one-time purchase usually needs payback close to the first order.
| Metric | What it measures | Typical DTC range |
|---|---|---|
| Gross margin | Revenue minus product cost | Varies widely by category and sourcing |
| Contribution margin | What's left after shipping, fees, fulfillment, returns, and support | Median 48%, with 31% of brands below 10% |
| CAC | Marketing spend per new customer | Depends on channel, category, and geography |
| LTV to CAC | Lifetime value compared with acquisition cost | Median 2.4x |
| Payback period | Time until a customer covers their acquisition cost | First order for some products, later orders for replenishment models |
Use the table as a reading order, not a scoreboard. Check contribution margin first, then payback, then LTV to CAC by product and order type. If you're comparing your store with others, a guide to how much Shopify stores make can help you separate store revenue claims from the economics underneath them. Scale a campaign only when those three measures line up for that specific product. That's how you avoid mistaking a busy dashboard for a healthy business.
The Channels and Operating Stack a DTC Brand Runs
A DTC brand isn't a website with a few apps attached. It's a connected system where a weak layer breaks the others. A great ad sends people to a slow checkout. A fast checkout creates orders your warehouse can't ship. Fast shipping still loses money if nobody measures why customers don't return. Build the stack as a system, layer by layer.
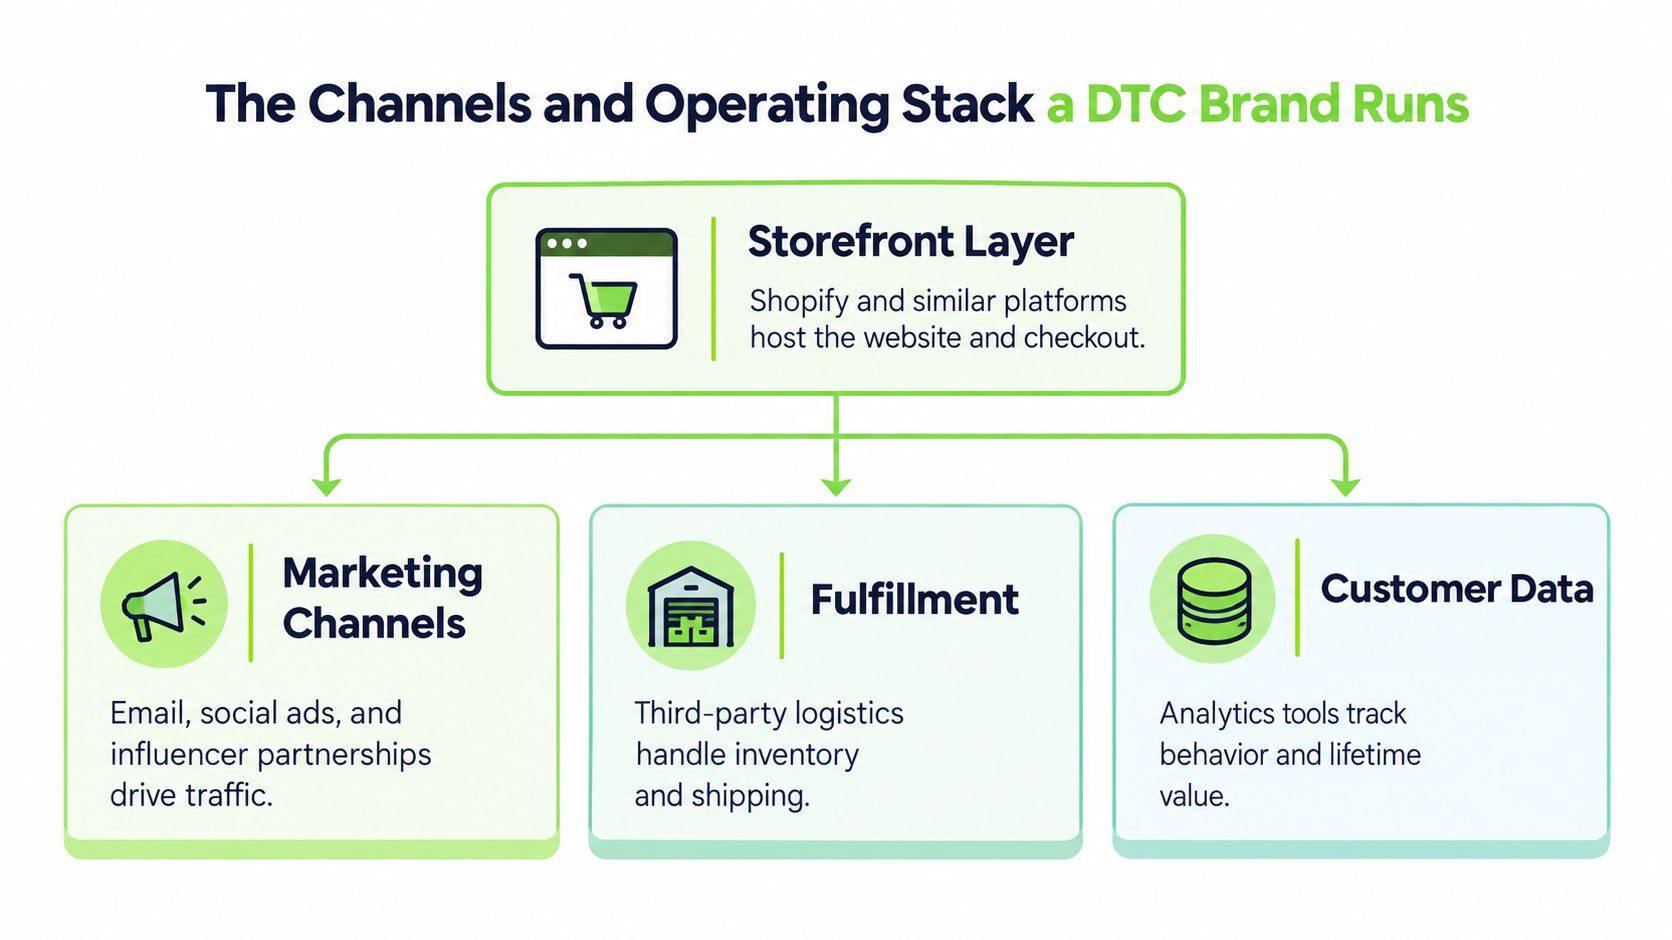
The image below maps the main layers most early brands assemble.
Storefront, payments, and fulfillment
Your storefront layer, often Shopify or a similar platform, hosts product pages, cart, and checkout. Look beyond themes. You need reliable checkout, clean product data, discount and bundle logic, and room to add subscriptions or post-purchase offers without rebuilding the store. If you're auditing a competitor, checking what apps a Shopify store uses shows you which functions they've chosen to add and where they may be investing.
Payments, tax, and fraud tools sit underneath that storefront. They decide which cards and wallets a shopper can use, how tax is calculated by region, and which suspicious orders get held for review. Founders underestimate this layer until a failed payment, a tax error, or a chargeback eats the margin on orders marketing worked hard to win.
Fulfillment is where promises become parcels. You can pack orders in-house for control at low volume, use a third-party logistics provider when volume and geography outgrow your space, or dropship when you don't hold stock at all. Each choice trades cost, speed, branding, and control differently. Pick based on your product size, return rate, and delivery promise, not on what a larger brand does.
The short video below walks through how these operating pieces fit together in a working store.
Marketing surface and the data layer
Most early brands get discovery from paid social, primarily Meta, because it lets you put a product in front of a defined audience quickly. Search and SEO capture people already looking for a solution. Creator partnerships borrow trust from someone the audience already follows. Email and SMS then do the quieter job of bringing existing customers back, recovering carts, and announcing products without paying for the same attention again.
Support belongs in that same picture. Helpdesk software, clear shipping updates, and an easy returns flow protect lifetime value because a well-handled problem often decides whether a first buyer becomes a second buyer. Finally, the data layer ties it together. Analytics, attribution, and your customer records show which channel brought which customer, what they bought, and what it cost to serve them. Without that layer, you're buying tools. With it, you're running a business you can steer.
What the Model Looks Like in the Wild
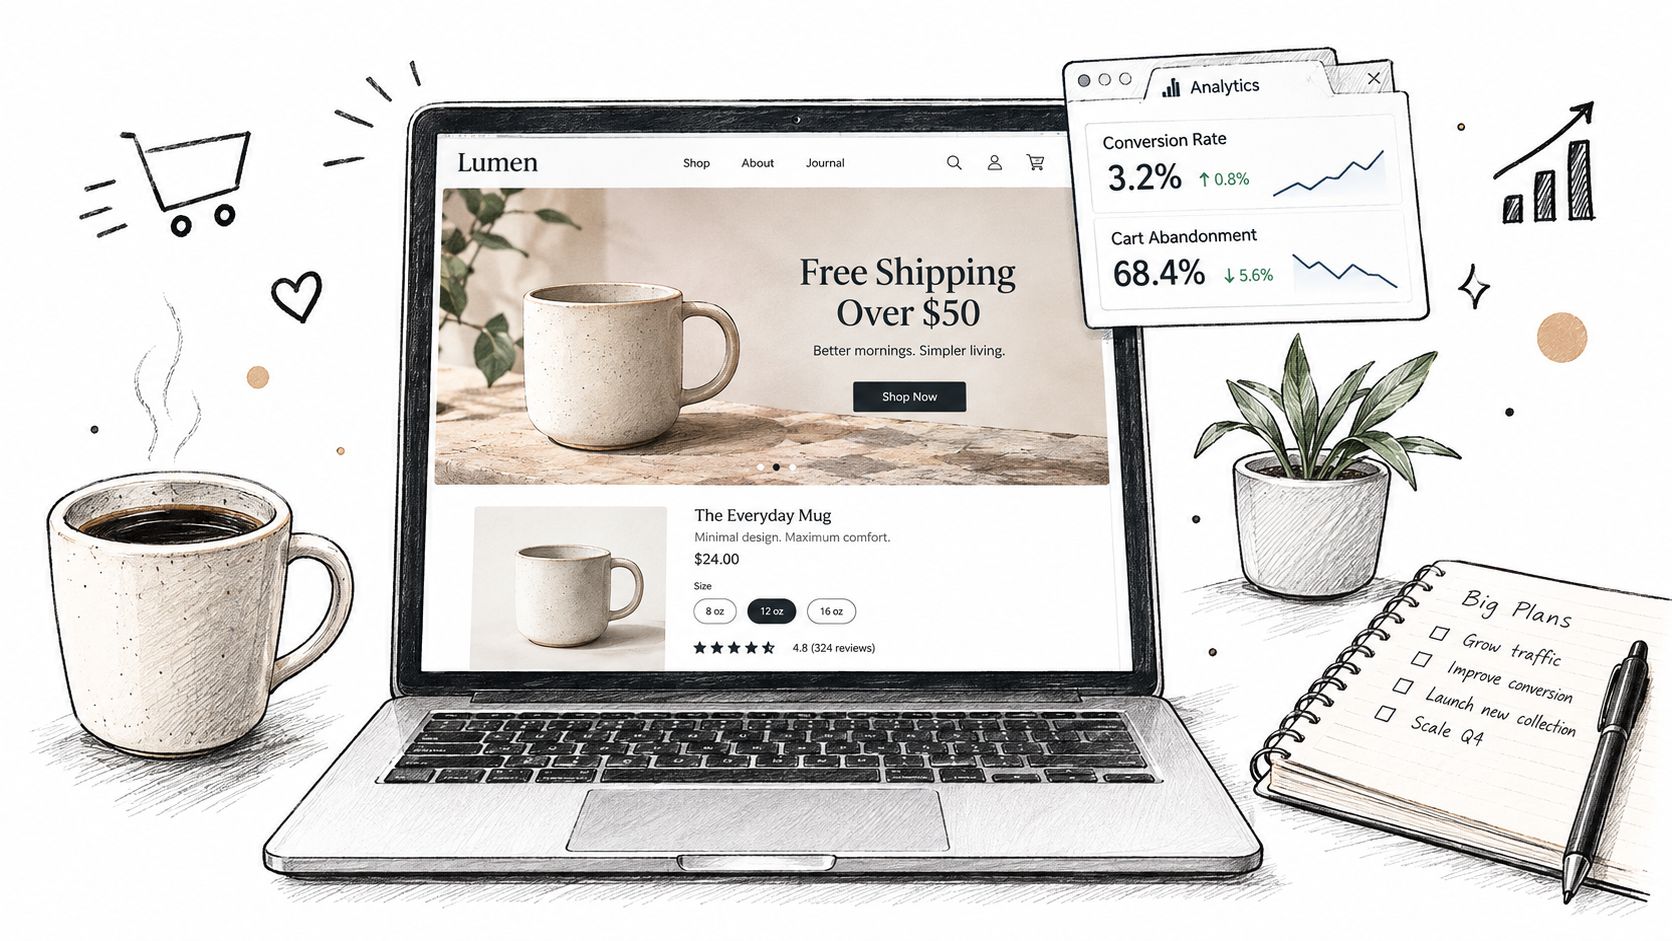
Abstract definitions get clearer when you watch a real store do its job. Open a typical DTC storefront and you'll usually see a hero product above the fold, a plainly stated offer, and one obvious next step. The product detail page carries the proof. Reviews, ingredients or materials, comparison points, guarantees, and answers to obvious objections all sit close to the buy button. The store isn't trying to show everything it sells. It's trying to move one visitor toward one conversion event without confusion.
Now look at the advertising footprint that feeds that page. A cold Meta creative introduces the problem or shows the product in use, then sends the click to a landing page built for that promise. A retargeting ad speaks differently because the visitor already knows the product. It might answer a price objection, show a review, or remind them of a bundle. After a visit without a purchase, an email or SMS flow takes over the conversation. Each channel has a job, and you can usually name that job by reading the copy and checking where the click lands.
Reading a competitor as a system
- Storefront signal: Which product leads, what offer frames it, and how much proof sits before checkout?
- Creative signal: Is the ad teaching a cold audience, proving a claim, or closing a warm one?
- Landing signal: Does the page repeat the ad's promise, or does the visitor have to start over?
- Retention signal: Are there visible capture points, bundles, subscriptions, or reorder prompts built into the experience?
Evidence beats guessing. AdLibrarySpy is one research workspace where you can search stores by category, platform, traffic, apps, and tracking pixels, then view a store's products alongside its Meta ad activity, creative copy, landing pages, and run dates. Used that way, it isn't a shortcut for copying a competitor. It's a way to see which parts of their system are active, how long a creative has been running, and whether their store and ads tell the same story.
The screenshot below shows that kind of combined store and advertising view.
Try the exercise on any brand in your category. Start at the ad, follow it to the landing page, read the product page, and note where email capture, reviews, and checkout prompts appear. If you can point to which channel is doing which job, you've understood dtc e commerce better than any definition alone can teach you. Long-running ads are a signal worth investigating, not proof of profit, because you still can't see the brand's margins, return rate, or support costs.
The Funnel Problems Most DTC Brands Underestimate
When sales stall, most founders ask for more traffic. It's an understandable instinct and often the wrong first move. If your checkout leaks ready buyers, extra traffic just sends more people into the same leak. Fixing the bottom of the funnel can produce revenue from visitors you've already paid to acquire, which is why checkout work is frequently more effective than another ad test.
The evidence is sobering. Baymard's checkout usability research, based on 344 leading US and European ecommerce sites, found 65% had a checkout rated mediocre or worse and only 2% were rated good. Baymard estimates the average large site has roughly 32 actionable checkout improvements and could achieve a potential 35% conversion-rate increase by addressing solvable usability problems. The average US checkout displays 23.48 form elements, while an optimized flow can be as short as 12 to 14 elements. Every extra field, surprise cost, forced account step, or payment hiccup adds effort between intention and a completed order.
Abandonment is not one problem
A blended abandonment rate tells you people left. It doesn't tell you whether they were ever ready to buy.
Baymard's cart abandonment research reports an average abandonment rate of 70.19% across aggregated studies, with 42% of US shoppers saying they abandoned because they were just browsing or not ready to buy, and 17% citing a checkout that was too long or complicated. Those are different problems with different fixes. A browser needs education, proof, email capture, or retargeting. A ready buyer blocked by form friction needs a shorter, clearer checkout.
So segment before you redesign anything. Split your funnel by acquisition source, device, new versus returning customer, landing page, and checkout step. Prospecting ads bring colder visitors and can make a healthy checkout look broken if you blend them with search and retargeting traffic. If you're mapping that traffic against the wider market, AdLibrarySpy's ecommerce ad landscape report gives you a way to see advertising activity in context before you blame your payment page.
The flaws to check first
- Too many form elements: Remove optional fields, combine name fields where sensible, and test guest checkout.
- Hidden total cost: Show shipping, taxes, and discounts early so the final total isn't a surprise.
- Forced account creation: Let people buy first and create an account afterward.
- Thin payment options: Offer the wallets and methods your customers already use on mobile.
- Vague shipping commitments: State delivery timing and returns terms before payment, not after.
Work through that list with device-level data, starting where high-intent traffic drops. You'll often find a measurable gain hiding in a form field or a shipping line, no extra ad budget required.
Operating Challenges Every DTC Founder Eventually Meets
Some challenges aren't a sign you've chosen the wrong product. They're structural features of dtc e commerce, and they arrive for almost everyone who stays in the model long enough. Naming them early lets you plan for them instead of treating each one as a surprise.
Rising acquisition cost is usually first. When many brands chase the same paid social attention, winning a click gets more expensive, and yesterday's profitable campaign can become today's break-even campaign without anything changing in your store. That pressure exposes the second challenge, the gap between acquisition and retention. If email, SMS, subscriptions, and community don't bring customers back, you keep renting growth from ad platforms. Margin is defended after the first order, in the reorder, the bundle, and the referral, not only in the first click.
Cash flow is the quieter strain. You pay for inventory before it sells, pay for ads before orders settle, and absorb returns after revenue has already been counted. A growing brand can feel successful and cash-poor in the same week. Operational drag adds to it. Returns need inspection, support tickets spike after a promotion, a fulfillment partner misses a cutoff, or your main distribution channel changes its rules. Dependence on Meta for discovery deserves special honesty here. A single platform can be an excellent starting channel and a fragile long-term plan if it's your only source of new customers.
A quarterly self-audit
- Contribution margin: What remains per order after shipping, fees, fulfillment, returns, discounts, and support?
- Payback period: How long until a new customer covers what you spent to acquire them?
- LTV to CAC: Does lifetime value justify acquisition cost for this product and channel?
- Retention rate: How many first buyers place a second order, and what prompts them?
- Checkout completion rate: Where do high-intent visitors drop, by device and source?
Track those five separately, not as one blended health score. A strong retention rate can hide weak checkout completion, and strong revenue can hide slow payback until cash runs tight. Serious operators revisit these questions every quarter because the answers shift as costs, channels, and customer behavior change.
You're not trying to eliminate every challenge. You're trying to see each one early enough to make a deliberate choice, raise a price, fix a checkout step, slow a campaign, build a retention flow, or develop a second acquisition channel before the first one becomes a dependency. That's the real skill underneath the model.
Before you copy a competitor's ad or rebuild your product page, look at their whole system, store, traffic, products, apps, and active Meta creatives in one place. AdLibrarySpy lets you research stores and Facebook and Instagram ads for free, save what you find, and track brands for changes over time. Start with one competitor in your category today and map which channel is doing which job.
More guides
Try AdLibrarySpy free
Search millions of stores and real Meta ads. No card, no trial — sign up with just your email.